Tracking · for creators
How to Build a Media Kit From Real Performance Data
- Lead with median views per post and a real date range, not follower count or your single best post.
- Show a small table of recent posts instead of one average — an average alone hides how skewed the numbers are.
- List engagement rate with the raw counts behind it, and say plainly what you have not done for a brand yet.
A media kit that works is built from your own tracked numbers, not your follower count. Lead with median views per post over a stated date range. Show a handful of real posts, not just your best one. Add an engagement rate you can show the arithmetic for.
Follower count tells a brand almost nothing about whether your posts get watched. Leading with it invites a question a weak media kit can't answer.
Below is what to include instead. You'll see how to lay out per-post numbers so they read as credible, not curated. You'll also see the specific things that make a brand's media buyer stop trusting a media kit on sight.
Why follower count doesn't do the job
Follower count answers a question nobody paying per view is asking. A brand paying per view cares about one thing: what a typical post from you actually does. That means how many people watch it, and whether they engage with it. Two creators can have the same follower count and completely different view counts. The gap only shows up in per-post data, not in a follower total.
This is also the fastest way to lose trust before a brand replies. A media kit that opens with a follower count, and nothing about views, reads as inexperienced. Or it reads like you're covering for a number that would look worse. Neither is the impression you want in the first ten seconds.
What to put in the media kit instead
Replace the follower-count headline with numbers that actually describe how your posts perform. Add enough context that the numbers are checkable, not just asserted.
- Handle and platform for every account you're offering, with the niche stated plainly
- A stated date range for the numbers, e.g. "last 90 days, 14 posts" — an unstated range is the first thing an experienced buyer questions
- Median views per post across that range, not an average
- A short table of individual recent posts, not a single rolled-up figure
- Engagement rate with the raw likes, comments and shares behind it
- Past brand deliverables and, where you can share it, what the post did — a link or a screenshot of the analytics
- Your rate structure, or a note that rates are quoted per campaign
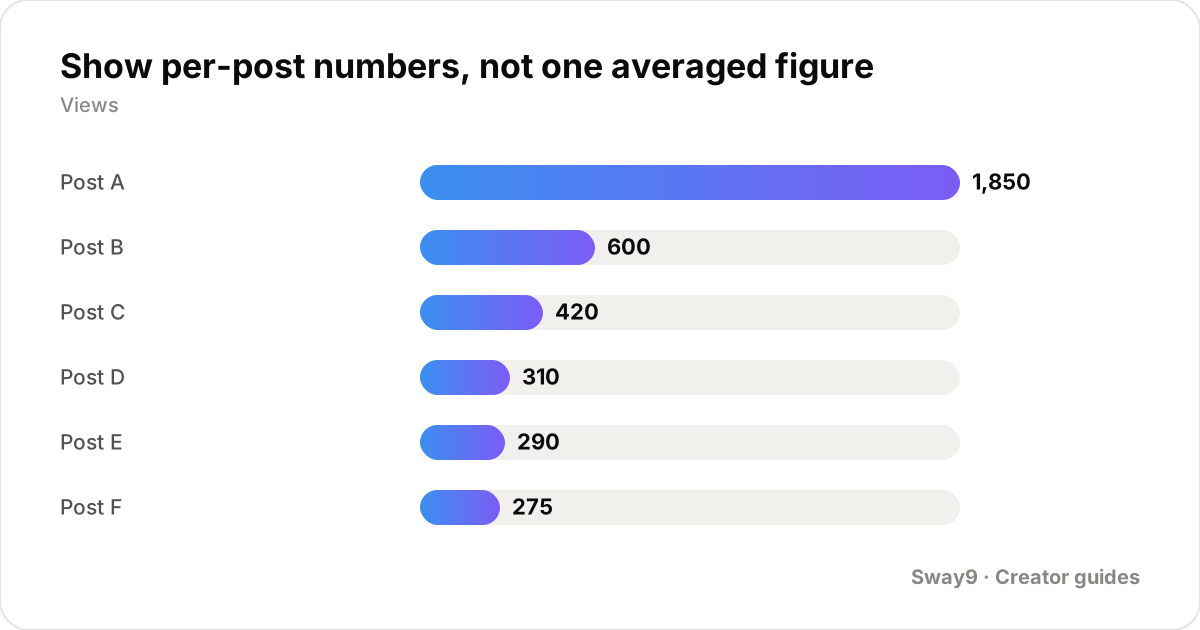
Show per-post numbers, not one averaged figure
A single "average views" number can be true and still misleading. One standout post can pull the average far above what most of your posts actually do. The fix is simple: show the individual posts, and let the brand see the spread themselves.
Take six recent posts from the same account and niche. Their views are 420, 290, 1,850, 310, 275 and 600 — see the worked example below. The average of those six looks like a healthy number. But one outlier, the 1,850-view post, pulls it up. Five of the six posts actually landed well under that average. Reporting the average alone, with no posts shown, overstates what a typical post in this deal will do.
| Post | Views |
|---|---|
| Post A | 1,850 |
| Post B | 600 |
| Post C | 420 |
| Post D | 310 |
| Post E | 290 |
| Post F | 275 |
Engagement rate, with the counts shown
Views tell a brand your reach. Engagement rate tells them whether people did anything after watching — a like, a comment, a share. That's a signal the post is doing its job, not just appearing in front of people. Show the formula, not just the percentage, so the number is checkable.
Take a post with 900 views, 54 likes, 12 comments and 3 shares — see the worked example below. Put the raw counts in parentheses next to the percentage in your media kit. It costs nothing, and it's the difference between a number a brand can trust and one they have to take on faith.
Describe audience fit, not just reach
A brand paying you cares whether the people watching are anywhere near their customer. Views alone don't answer that. You don't need a demographics dashboard to speak to this. Describe your audience the way you'd describe it to a friend. Name the niche your content sits in, the kind of comments you typically get, and whether your audience buys what the brand sells.
If you post in more than one niche across accounts, say which account fits which kind of brand. Don't present one combined pitch for everything. A skincare brand reading a media kit that mixes gaming clips and beauty routines has to do the sorting themselves, and most won't bother.
Lay the document out in an order that front-loads the answer
The order of a media kit matters almost as much as the numbers in it. A brand contact skimming ten of these in a morning decides fast whether to keep reading. Put the median-views figure and the date range at the top, before your bio or a photo. The numbers are why you're being considered — don't bury them under introductory copy.
Keep it to one or two pages. A media kit that reads like a portfolio website invites skimming, not the close read the numbers deserve.
- Median views, engagement rate and date range — at the top
- The per-post table — next
- Past brand deliverables, with results
- Audience fit and niche
- Rates, or a note that they're quoted per campaign
- Contact details — last
What brands distrust in a media kit
A few patterns reliably make an experienced brand contact skeptical. Check your own media kit against these before you send it.
- A single screenshot of your best-ever post, presented as typical, with no other posts shown
- Numbers with no date range attached, so there's no way to tell if they're from three years ago or last week
- Follower counts added across platforms as one combined total
- Engagement percentages with no underlying like, comment or share counts
- Past brand names listed with no result attached — a client logo proves you were hired, not that the post performed
Where the numbers actually come from
Building this from spreadsheets and screenshots each time is the part most creators skip. That's why so many media kits fall back to a follower count instead. In Sway9, you add your own TikTok or Instagram handles once. The app pulls every post and its views automatically, and keeps a per-post daily history.
The median views and per-post table above become a CSV export, not a re-count each time. The free plan covers 3 tracked accounts with 100 credits a month. Paid plans start at $22 a month for 25 accounts, for a manager building kits across a roster.
Frequently asked questions
Should a media kit include follower count at all?
It's fine as a small supporting detail, but it shouldn't be the headline number. Lead with median views per post and engagement rate. Let follower count sit lower down as context.
How many posts should I show in the per-post table?
Enough to show a realistic spread. Six to twelve recent posts from the same account and niche is usually enough. That makes the median meaningful without turning the media kit into a spreadsheet dump.
What if my recent posts have underperformed?
Show them anyway. Add a note about what changed, if you have one — a new format, or a platform algorithm shift. A media kit with an unexplained gap reads worse than one with a few soft weeks in it.
Should I make a different media kit per platform?
If your view counts differ a lot by platform, yes. A combined table across platforms with very different typical views buries the platform where you're actually strong.
How often should I update it?
Before any pitch where the data is more than a month old. A stale media kit undercuts the credibility it's meant to build. That's especially true if your posting frequency or performance has changed since the last version.
Track your own accounts
Add your TikTok and Instagram handles, set each brand deal up as a campaign with its rate, and Sway9 pulls in every post and view and works out what the deal is worth. From $22/mo, cancel any time.
Get started Cancel any time · unlimited team members on every plan