Tracking · for talent managers
Views vs Engagement: How to Measure Creator Performance
- Use views to judge pay-per-view deals, since that is literally what they pay against. Use engagement rate and saves for favorability or reaction deals.
- Engagement rate = interactions (likes + comments + shares + saves) ÷ views × 100. Compute it before comparing posts with different view counts.
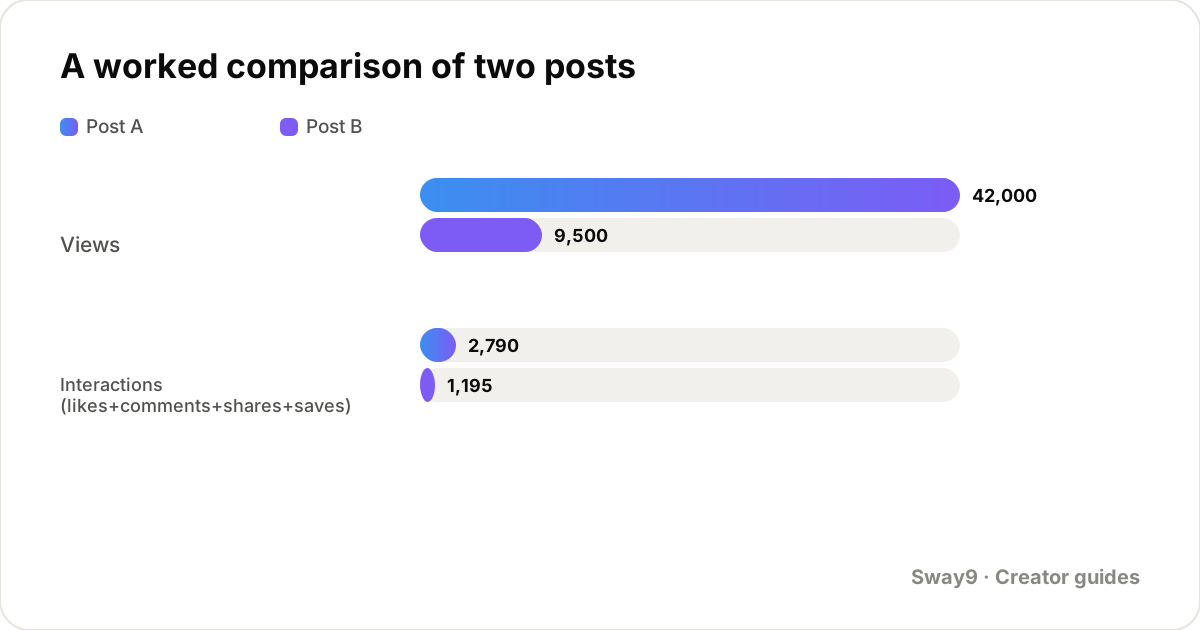
- A worked comparison below shows a 4x view gap between two posts, while the smaller post nearly doubles the bigger one's engagement rate.
Which metric matters depends on what the deal is paying for. If a deal pays per view, views decide the payout, full stop. If a deal is paying for brand favorability or community reaction, engagement rate, saves and watch-through tell you more than the raw view count does. A post can reach a lot of people without a single one of them caring.
Comparing creators or posts on only one of these metrics, regardless of deal type, is how a manager ends up crediting the wrong post. Below is what each metric captures. Then a side-by-side comparison of two real posts shows the 'better' one flip depending on which metric you judge by.
Views: what they capture and where they fall short
A view count tells you how many times the post was played, by the platform's own counting rules. It's the correct metric for anything paid per view, since that's the literal basis of the payout. It's also a reasonable proxy for reach: how many people the content was put in front of, regardless of whether they reacted.
Where views fall short is telling you anything about reaction. A post can be watched 50,000 times by people scrolling past without registering the brand at all.
The view count alone won't distinguish that from 50,000 people who watched closely and remembered the product. For a pure reach or pay-per-view deal, that gap may not matter to the payout. For almost any other deal, it matters a lot.
Engagement rate: the formula and what it signals
Engagement rate is the share of viewers who did something beyond watching: liked, commented, shared, or saved the post. A common way to compute it: add up likes, comments, shares and saves, divide by views, then multiply by 100 to get a percentage. Include saves where the platform reports them — a save is often a stronger signal of intent than a like.
Engagement rate matters most for deals where the brand cares whether the content actually landed. Think awareness campaigns, brand-favorability deals, or anything judging whether the audience reacted well, not just whether they were exposed to it.
A high view count with a low engagement rate can still be a fine outcome for a pure reach deal. It's a weak result for a deal that's really asking 'did people like this.'
Watch-through and average watch time: useful, but rarely visible externally
Watch-through means how much of the video people actually watched before scrolling away. It's one of the strongest signals of whether content held attention.
But it's usually only visible to the account owner, through the platform's own creator analytics. An outside brand or manager can't see it on the public post. If you have your own watch-through data, share it with a brand as a supporting screenshot alongside the public metrics.
Without direct access to that data, a rough external proxy is the shape of the comments. Comments that mention something from later in the video — a punchline, a specific step, a product detail near the end — suggest more people watched that far.
A caption-only reaction wouldn't tell you that. This is a soft signal, not a substitute for real watch-through data. Treat it as a tiebreaker, not a primary metric.
Saves: a strong, underused signal
A save means someone thought the content was worth returning to: a recipe, a product to look up later, a technique to reference again. That's a meaningfully stronger signal of genuine interest than a like, which can be given in half a second while scrolling.
Some products benefit from being remembered rather than acted on instantly — a home item, a recipe-adjacent product, anything with a longer purchase cycle. For those deals, weigh saves more heavily than the blended engagement rate formula does on its own.
A practical habit: track saves as their own line, separate from the blended engagement rate, whenever the deal type suggests intent matters more than immediate reaction. Two posts can have identical engagement rates but very different save shares behind that number, and those are different outcomes even though the summary percentage looks the same.
A worked comparison of two posts
Two posts from the same account, both sponsored by different brands in the same month. Post A is a broad-appeal lifestyle video. Post B is a more specific, niche-audience post.
| Metric | Post A | Post B |
|---|---|---|
| Views | 42,000 | 9,500 |
| Interactions (likes+comments+shares+saves) | 2,790 | 1,195 |
| Engagement rate | 6.64% | 12.58% |
| Payout at $4 CPM | $168.00 | $38.00 |
Reading the comparison by deal type
If both posts ran under a pay-per-view deal at the same $4 CPM, Post A is unambiguously the stronger result. It earned $168.00 against Post B's $38.00, and the deal is paying for exactly that: views. Judged purely on payout, there's no argument for Post B.
If the brand's goal was favorability instead, Post B is the stronger post despite the much smaller view count. Its engagement rate of 12.58%, against Post A's 6.64%, means Post B's viewers were proportionally almost twice as likely to react. A manager reporting only view counts to a favorability-focused brand would be reporting the wrong headline number, even an accurate one.
Decide which metric matters before comparing posts, based on what the specific deal pays for. Don't default to whichever number is bigger. A roster of ten creators can rank completely differently by total views versus by engagement rate, and neither ranking is wrong — they answer different questions.
Reporting both numbers without confusing a brand
When reporting performance to a brand, state the raw numbers. If the deal isn't purely pay-per-view, add the engagement rate too, with a one-line note on what it means for this post. Avoid picking whichever single metric makes the result look best and presenting only that one. A brand that later checks the public post and sees a different picture will trust future reports less.
This applies just as much when reporting across a whole roster. If you manage several creators, show both the total views delivered and the engagement rate spread across posts. A campaign total can be dominated by one or two large-reach posts, while the rest of the roster quietly delivers much higher engagement on far fewer views. Either number alone tells an incomplete story.
Frequently asked questions
Which single metric should I lead with when reporting to a brand?
Lead with whichever metric the deal actually pays against: views for a pay-per-view deal, engagement rate or saves for a favorability-focused one. Include the other numbers as context rather than omitting them.
Is a 12% engagement rate actually good?
It depends heavily on the platform, format and account size. Smaller, niche accounts often post higher engagement rates than large broad-appeal ones. Compare a post's rate against that same account's own recent history, not against a fixed industry number, since no single benchmark applies evenly across accounts.
Should saves count double in an engagement rate calculation?
There's no single standard formula. Summing likes, comments, shares and saves over views is a reasonable default. If a deal specifically cares about save-driven intent, report saves as their own number alongside the blended engagement rate, rather than folding them in silently.
Can I get watch-through data on someone else's post?
No, not from the public post itself. Watch-through is only visible to the account that posted it, through that platform's own creator analytics. If you need it for a report, it has to come from the creator sharing their own analytics screenshot.
How do I compare two creators fairly if one has a much bigger account?
Compare rates, not raw totals. Use engagement rate rather than raw like count, and payout per view rather than total payout. A bigger account will naturally win on every raw total, regardless of how well either post actually performed relative to its own reach.
Track your whole roster in one place
Every creator's accounts, every deal set up as a campaign with its rate, every post and view pulled in automatically. From $22/mo for 25 tracked accounts, unlimited team members, no per-seat fees.
Get started Cancel any time · unlimited team members on every plan